
LIT Fischer developed his light-graphics step by step, an oscillating rhythmically-flowing, undulating movements on the screen – "heterophonics" – as he calls them. The variety of the undulating lightwaves, often brought about by minute deviations from the original program, fascinate the artist. With his light-movement studieshe actually succeeds in visualizing series of musical tones, sound sequences and meditative song. Dr. Eva Karcher
by CF Bolz-Tereick, December 2018
I've been fascinated by the light art installations of artist Jürgen LIT Fischer since a while, e.g. "Fraktal" as part of the Tetraeder in Bottrop:
Photo CC-BY Mirek Claßen
Later I found out that LIT Fischer used to do computer art in the 1980s using Fortran and a plotter. Here are two examples:
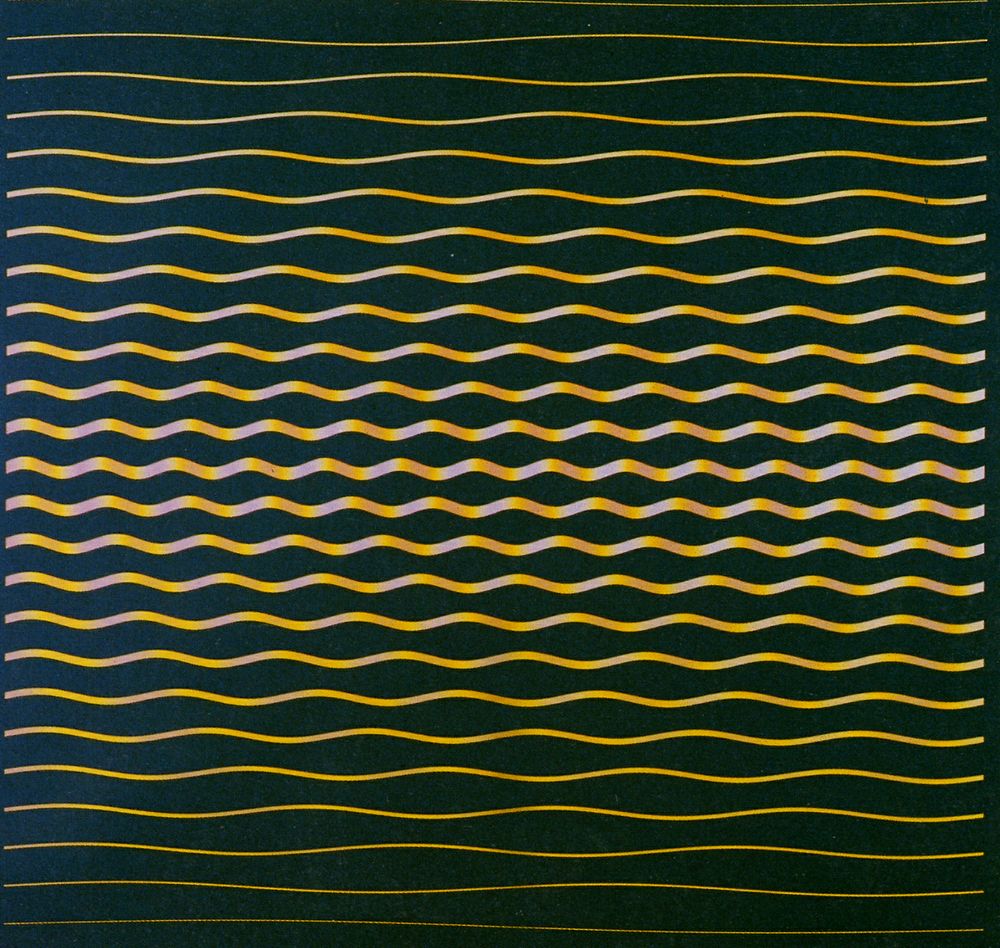
"Mit Zwischenraum, hindurchzuschaun" ("with space between to look through"), Jürgen LIT Fischer, 1986. Aside: the title is a part of a poem by Christian Morgenstern, "Der Lattenzaun" (click through for an English translation)
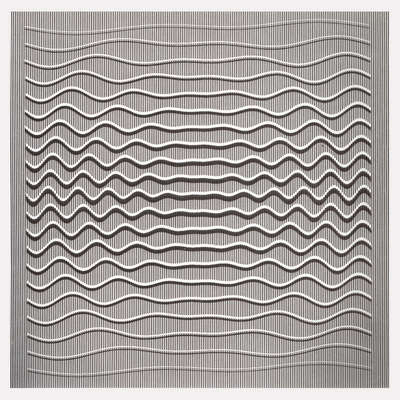
"Intervalle" ("intervals"), Jürgen LIT Fischer, 1987
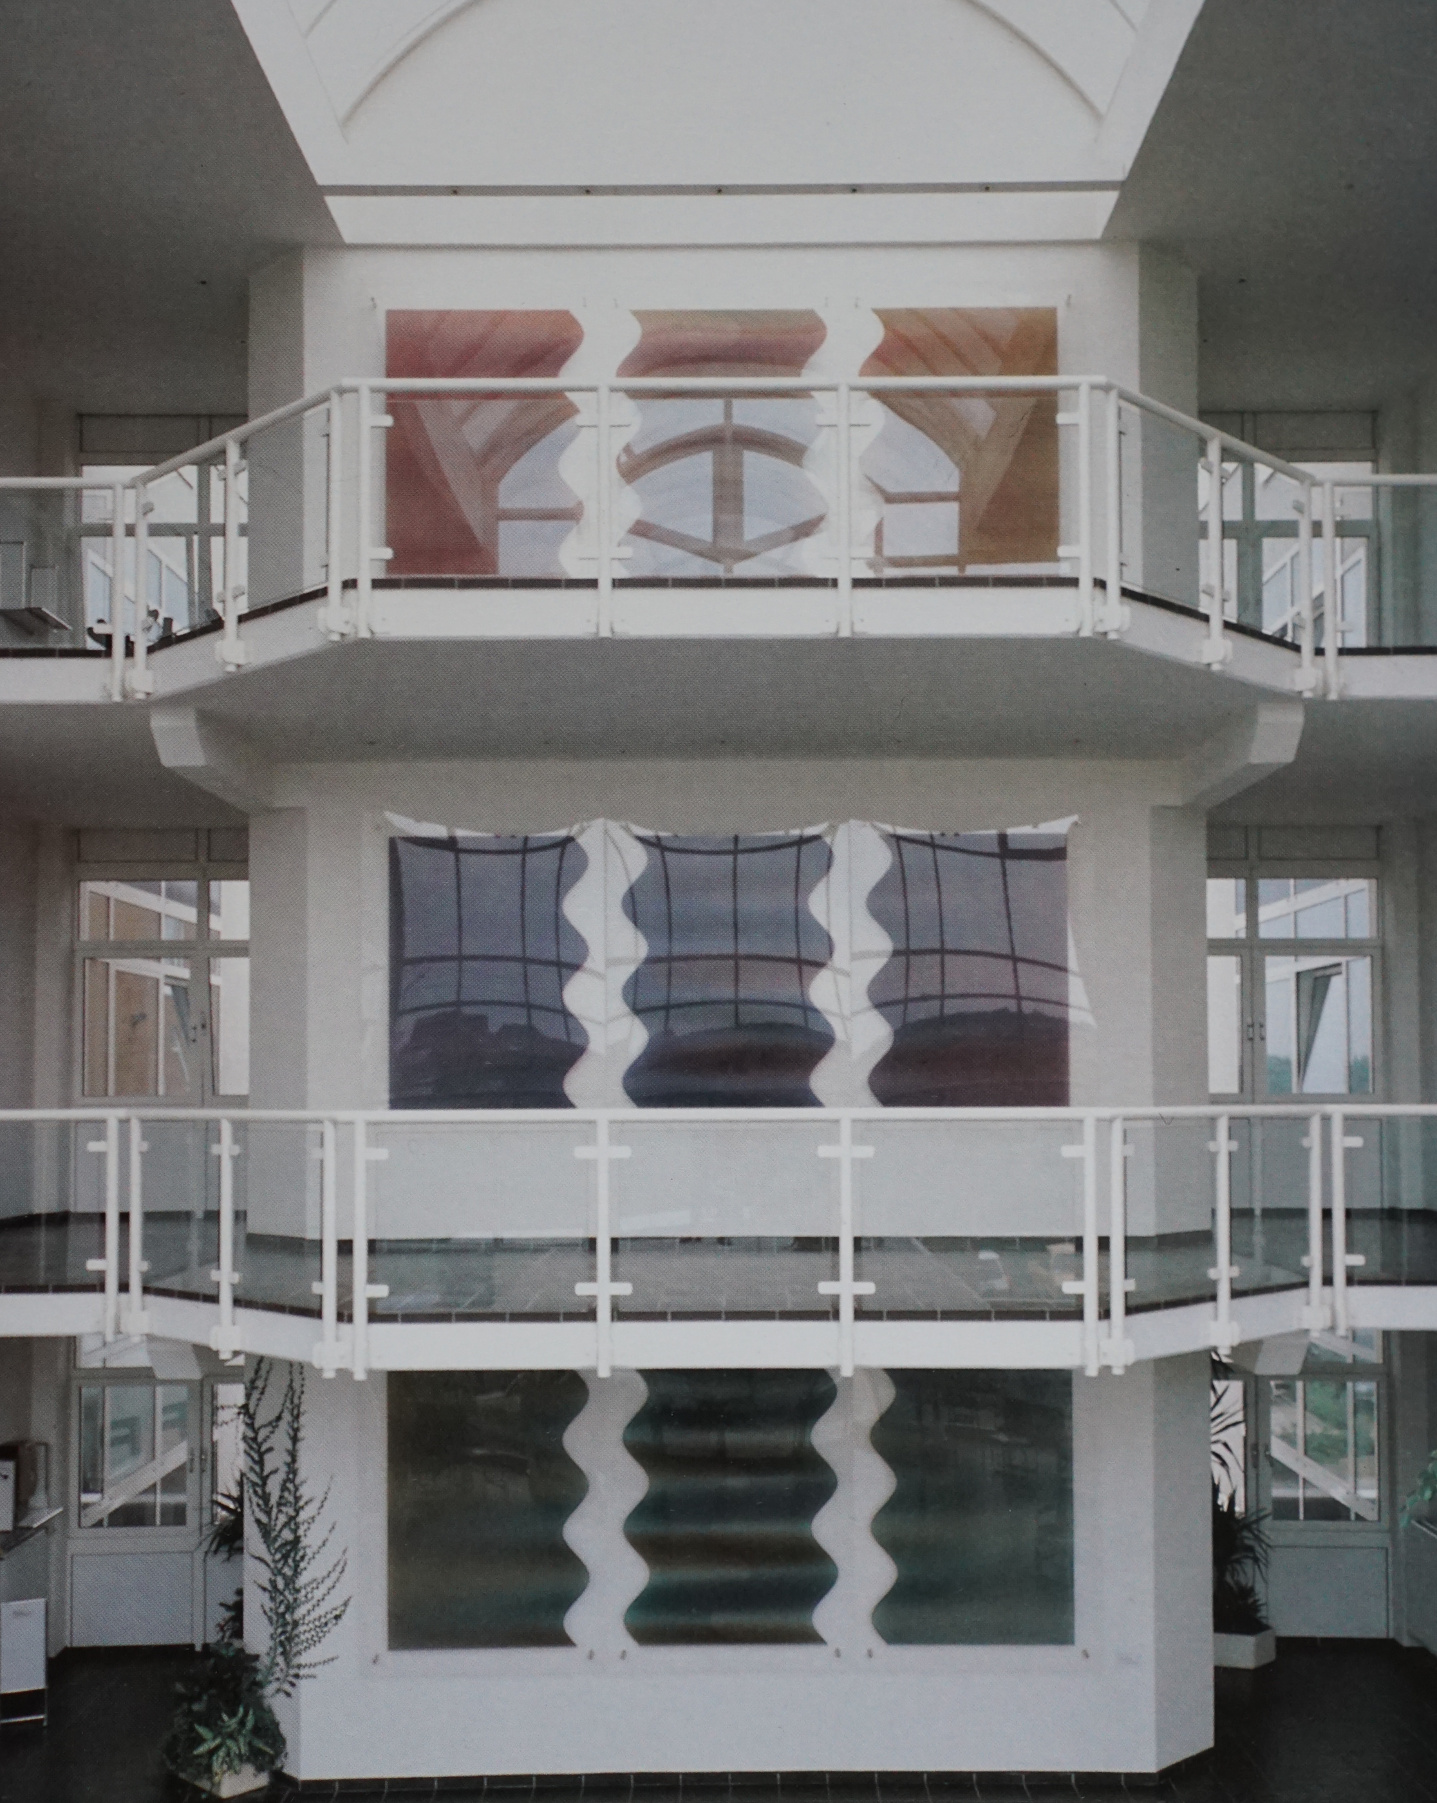
"Dreiklang" ("triad"), Jürgen LIT Fischer, 1987
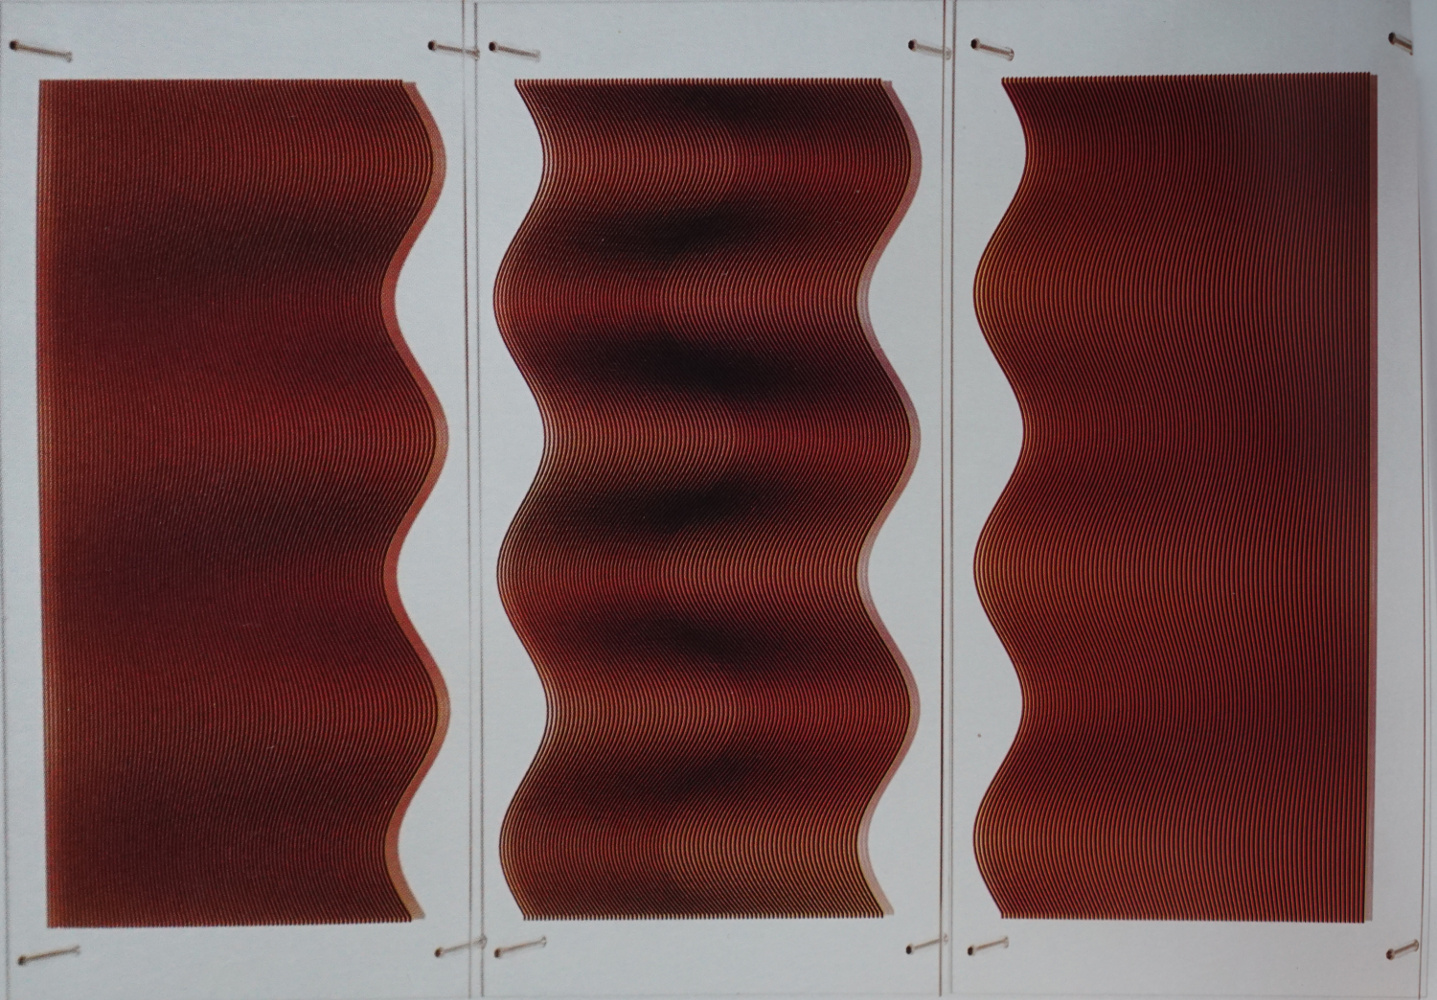
"Dreiklang", top three panels, 1987
Looking through some of the books about his exhibitions I found that one of them contained fragments of the Fortran code that he used as the basis of one of the installations:
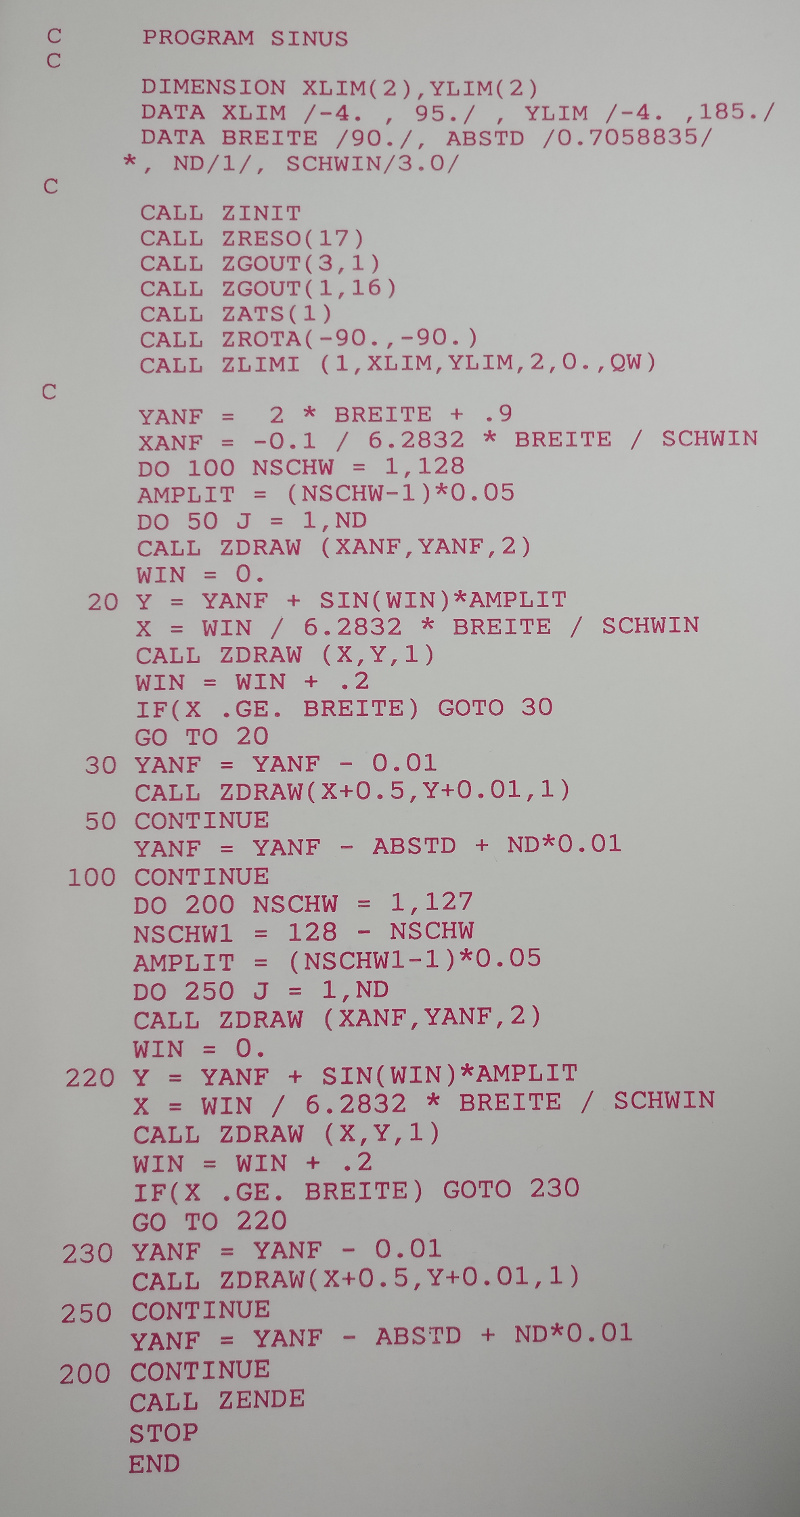
Despite not knowing Fortran I decided to still try to port the code to Javascript (which I of course also don't really know, but at least it's easier to Google and more importantly, to run). I guessed that the Z* functions were responsible for communicating with the plotter. In particular that the ZDRAW function had to move the plotter pen somehow.
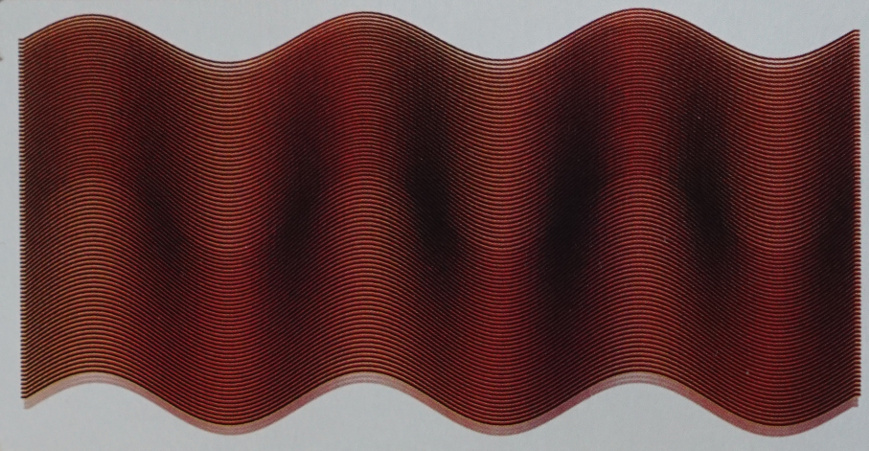
After some amount of fiddling I managed to produce the output below. I used different parameters than in the Fortran source, but reading some more about his working style, Fischer anyway played around with the parameters a lot (in fact, his final output is usually a layer of many different semi-transparent versions of the outputs of the same program, using different colors).
What we see is basically a series of sine waves, plotted at a fixed distance below each other. They all have the same frequency but the amplitude goes up from 0 to some value, and then down to 0 again. What I find cool is how simple the ingredients are: just lots of sine waves, but the result is still quite an interesting effect.
Compared to the Fortran code I changed things somewhat: I fixed the code duplication between the code that computes the upper and the lower half of the waves and I removed the extra level of loops responsible for increasing the stroke width by drawing the same line several times with a tiny offset (that's much easier in svg!). I also tried to translate the variable names from abbreviated German to English. If you want to read or modify the source code, use the Glitch button in the upper right corner!
In the picture of the real artwork above, those waves are split up into three acrylic glass panels. In the top middle panel there is what looks like some strange discontinuity in the middle.
"Dreiklang", top middle panel, rotated
I suppose that was done intentionally, but I still wanted to try to figure out where it came from. And indeed, playing with the parameters some more, we can reproduce it:
To understand this effect, let's look at an even more exaggerated view:
I have added in red to the left the size of the amplitude of each sine wave. On the peak of every wave, the lines above bunch together, and the lines below are spread apart. The eye notices the sharp jump between the distances of the lines in the middle. The reason for that jump is the fact that the amplitudes of the stacked waves vary linearly up, and then down. But since that interpolation function is piecewise linear, it has a non-smooth part in the middle.
This is going beyond understanding the original code, but we can fix that! Instead of interpolating the amplitudes linearly, we can do it smoothly, e.g. again with a sine wave:
If you want to play around with the parameter space too, here's an interactive version: